Dominik Roth
399f69b817
Dominik Roth
399f69b817
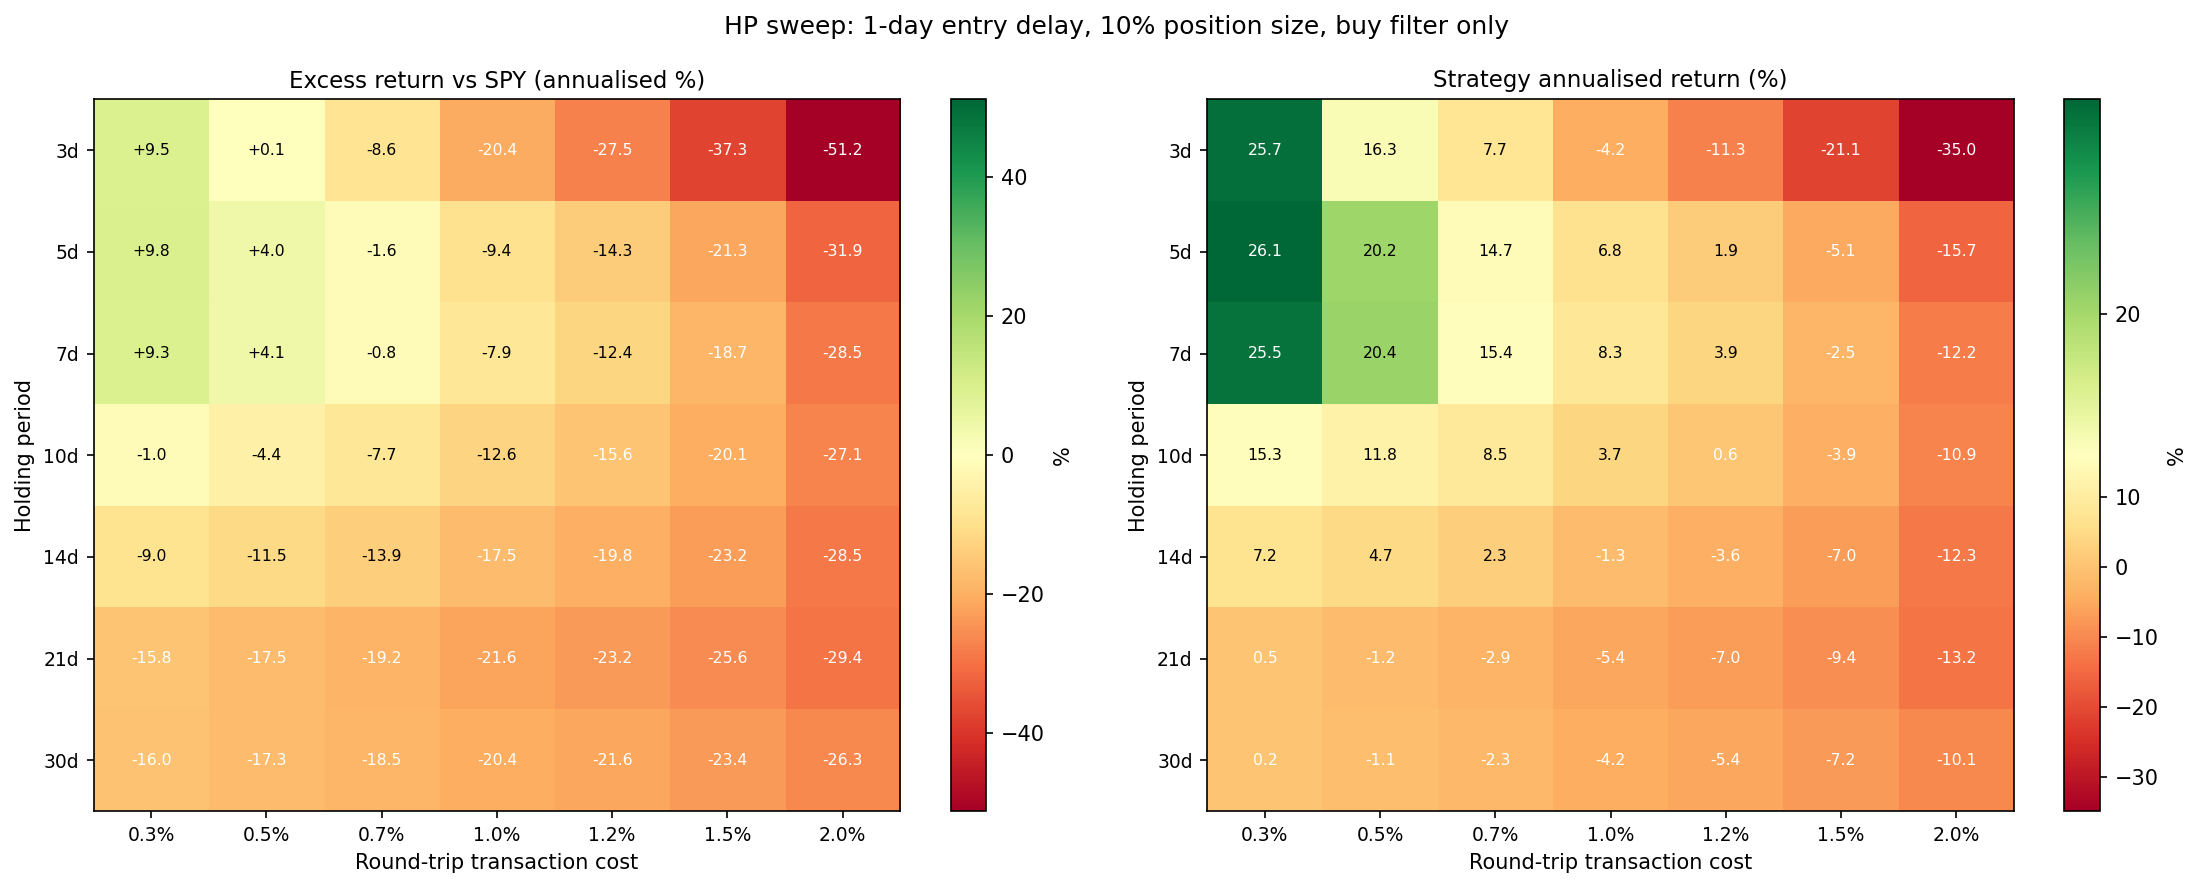
- backtest/plot.py: generates two plots saved to plots/
  - hp_sweep.png: 7x7 heatmap of holding_days x round-trip cost, showing
    annualised excess vs SPY and raw annualised return per cell
  - equity_curves.png: portfolio equity vs SPY for 4 cost scenarios
- backtest/simulate.py: accept pre-loaded prices dict to avoid reloading
  on every sweep iteration; return equity_curve in result
- main.py: add `plot` command
- README: updated results section with Alpaca-specific cost breakdown
  (zero commission, costs are spread+slippage only); added honest analysis
  of why insidercopytrading.com-style services show outperformance that
  cannot be replicated in practice; note Alpaca integration not finished

Co-Authored-By: Claude Sonnet 4.6 <noreply@anthropic.com>
127 KiB
2201x888px
127 KiB
2201x888px